Centralize Log Files with Logstash and search using Kibana
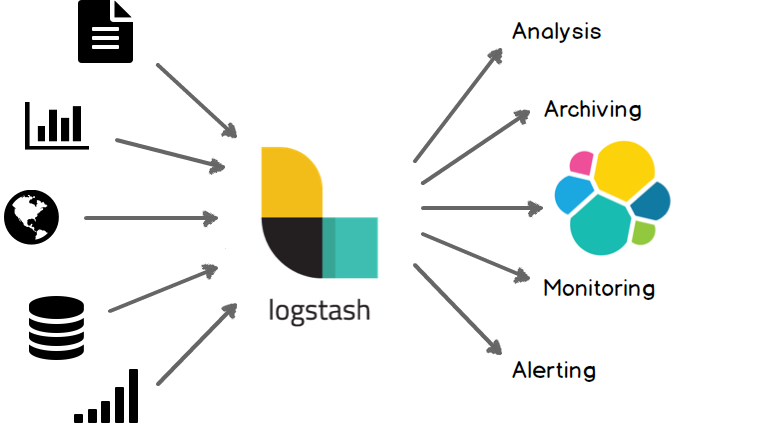
Logstash
Logstash Reference [7.2] » Logstash Introduction
Lightweight Shipper for Windows Event Logs
Keep a pulse on what’s happening across your Windows-based infrastructure. Winlogbeat live streams Windows event logs to Elasticsearch and Logstash in a lightweight way.
Winlogbeat has added two new modules in this release. The Sysmon module monitors event log records from the Sysinternal System Monitor and the Security module monitors Windows Security event logs. We’ve also added support for the newer Windows XML Event Log (EVTX) format.
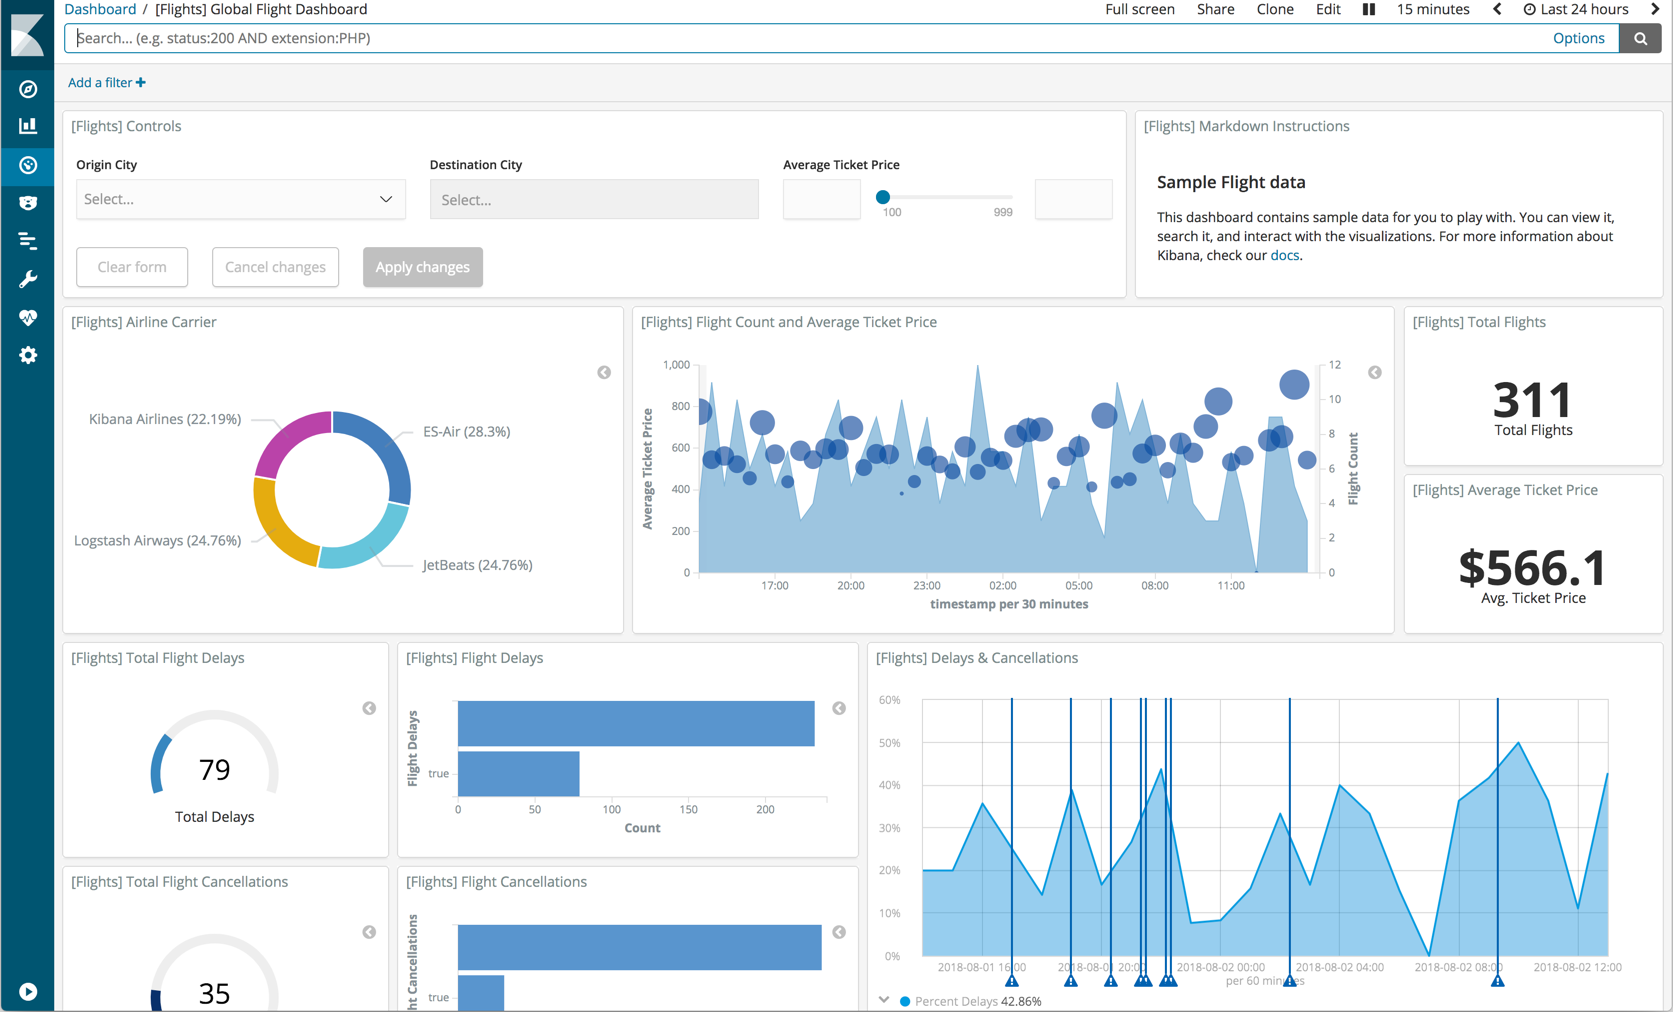
Kibana
Kibana is an open source analytics and visualization platform designed to work with Elasticsearch. You use Kibana to search, view, and interact with data stored in Elasticsearch indices. You can easily perform advanced data analysis and visualize your data in a variety of charts, tables, and maps.
Kibana User Guide [7.2] » Introduction
Elasticsearch
Elasticsearch is the distributed search and analytics engine at the heart of the Elastic Stack. Logstash and Beats facilitate collecting, aggregating, and enriching your data and storing it in Elasticsearch. Kibana enables you to interactively explore, visualize, and share insights into your data and manage and monitor the stack. Elasticsearch is where the indexing, search, and analysis magic happen.
Elasticsearch provides real-time search and analytics for all types of data. Whether you have structured or unstructured text, numerical data, or geospatial data, Elasticsearch can efficiently store and index it in a way that supports fast searches. You can go far beyond simple data retrieval and aggregate information to discover trends and patterns in your data.
Elasticsearch Reference [7.2] » Getting started with Elasticsearch