NetFlow Basics: An Introduction to Monitoring Network Traffic
by Steve Petryschuk | March 19, 2019 Network management Network monitoring
To fully understand what NetFlow is and why it’s used for network monitoring, we first need to know what a flow is.
When computers need to talk to one another they establish communication channels, commonly referred to as connections. (Technically speaking, these communication channels can only be called connections when the TCP protocol is involved.) A flow refers to any connection or connection-like communication channel.
In more technical terms, a flow is defined by its 5-tuple, a collection of five data points:
- Source and destination IP addresses exchanging information
- Source and destination ports, if any (ICMP, for example, doesn’t use ports)
- The protocol
Flow identifies a communication channel, and all packets sharing the same 5-tuple fields belong to the same flow.
NetFlow is functionality built into network devices that collects measurements for each flow and exports them to another system for analysis. For example, NetFlow captures the timestamp of a flow’s first and last packets (and hence its duration), the total number of bytes and packets exchanged, a summary of the flags used in TCP connections, and other details.
By collecting and analyzing this flow data, we can learn details about how the network is being used. For example, flow analysis is helpful in troubleshooting network issues, identifying bandwidth hogs, and tracking which external IPs or countries you’re exchanging data with.
The evolution of NetFlow
NetFlow was originally introduced in Cisco routers as a way to summarize network flow data for packets routed over Cisco equipment. It was first introduced in 1995 as a software-based technique for use on LANs but it didn’t scale well for high-bandwidth connections and was eventually replaced by another technique called express forwarding.
Cisco realized, however, that having network flow data was very useful and implemented NetFlow in hardware instead.
Over the years, NetFlow has become the de facto industry standard that other vendors have imitated. To avoid trademark issues, other vendors have given their flavor of flow analysis different names. For example, Juniper offers J-Flow, Huawei offers NetStream, and sFlow is a multi-vendor offering. (sFlow is actually quite a bit different than the rest but we’ll leave that discussion for another time.)
In fact, flow-based monitoring protocols became so popular that in 2008, the IETF released IPFIX, which is now the official industry standardization of NetFlow.
NetFlow itself followed an interesting evolution over the years. Starting as a static protocol with a fixed set of statistics collected for all flows, it’s now extensible. In version 9, the latest version, you can choose which statistics to enable and vendors can implement extensions to attach proprietary information to flow entries. IPFIX is sometimes described as NetFlow v10 because it’s so similar to NetFlow v9.
Throughout this article, we’ll continue to refer to NetFlow because it’s still the most widely used standard, but everything we discuss pertains generally to all other flow protocols.
How does NetFlow work?
Using NetFlow requires three pieces:
- Flow exporter: an appliance or network device (usually a router or firewall) in charge of collecting flow information and exporting it to a flow collector.
- Flow collector: an appliance or server that receives exported flow information.
- Flow analyzer: an application that analyzes flow information collected by the flow collector.

Generating NetFlow data starts at the network device when a packet arrives. First, the device checks if the packet’s 5-tuple is present in a table of recently seen flows called the flow cache.
If the 5-tuple is in the table, the cache entry is updated: packet count is incremented by one, byte count is increased by packet length, and so on. If the flow isn’t in the cache, it means the packet belongs to a previously unseen flow, so a new entry is added to the table.
Of course, the whole point of NetFlow is to export information to a collector for storage or analysis. For this reason, the flow information is periodically exported to the flow collector in a process known as flow expiration.
A specific flow entry expires under two scenarios:
- Inactive timeout. If a flow is inactive—no packets have been observed for it for a while—it’s assumed the flow has finished and the entry expires. Typically, the timeframe for inactivity is configured to 15 seconds.
- Active timeout. If a flow remains active for a certain period of time, it expires. The default for active timeout on many platforms is as long as 30 minutes.
An active timeout may seem counterintuitive but the timeout exists so the flow analyzer can get information for long-running flows sooner rather than later. Long flows tend to be “elephant” flows that carry large amounts of data, and learning about their existence only after they finish is counterproductive. A forever-running flow would never expire and would thus escape detection!
Many devices come programmed with active timeout values that are less than ideal. Thirty minutes, or even five, is too long. We recommend using an active timeout value of one minute so the flow analyzer is frequently receiving information about the network and can present a more accurate representation of what’s happening on it.
Once the flow collector receives a flow entry, it forwards it to the flow analyzer, which extracts and presents relevant insights.
What can you see with NetFlow?
Every analyzer extracts different pieces of information from the incoming flow data. In TrafficInsights within Auvik, for example, you can see:
- All flows across flow-monitored devices
- Traffic by application, protocol, domain, source and destination IPs and ports
- Top addresses, conversations, and autonomous systems
- Sources and destinations by geo-location
This data can help you answer questions like:
- Who’s using banned applications such as BitTorrent
- Who’s hogging bandwidth and slowing down the network
- Why your client’s web server is receiving so many connections from North Korea
- What a hacked server was connected to during an infection
NetFlow is low overhead
The bandwidth needed to export NetFlow data is typically less than 0.5% of total bandwidth consumption. For example, if you’re monitoring a link with 100 Mbit/s usage, the router would consume an extra 0.5 Mbit/s to export the NetFlow data.
If bandwidth usage is a concern for you, most vendors offer a feature called sampled NetFlow. Sampled NetFlow is the statistical sampling of packets where only one out of N packets are processed by NetFlow and the rest are skipped. Statistical sampling preserves most of the important flow properties as long as the analyzer is aware that sampling is enabled.
Certain router models can’t keep up with full NetFlow computing and implement sampling as a way to reduce CPU load. If your client network moves large volumes of traffic and the device on it supports sampled NetFlow, it’s a good idea to enable it.
As a rule of thumb, sampling 1 out of 64 to 1 out of 100 packets should be safe for gigabit-scale bandwidth usage, while 1 out of 1,000 to 1 out of 10,000 packets is recommended for multi-gigabit to multi-terabit usage. Refer to the equipment vendor’s documentation for further guidance.
NetFlow gives you deep network visibility
Flow analysis tools are the most commonly deployed network visibility tools in the service provider world. Alternatives include deep packet inspection, which tends to be overkill on most client networks, and active monitoring, which as the name implies introduces an unnecessary load on the network.
The biggest advantage to using flow analysis is that you almost certainly have NetFlow or IPFIX support on your client devices already— you simply need to activate it and point its output to a collector.
Installing flow analysis is easy and relatively inexpensive. Extra hardware is almost never needed. Configuration is limited to a few nodes on the network and can be completed in a few minutes with zero downtime.
This means you can quickly add flow analysis to a client network and instantly gain vital insights into all traffic flows.
In the example below, configuring NetFlow on the main router connected to the internet (R1) lets you monitor all the traffic in and out of the company, and to watch for any attacks on the servers in the DMZ. This is typically referred to as north-south traffic.
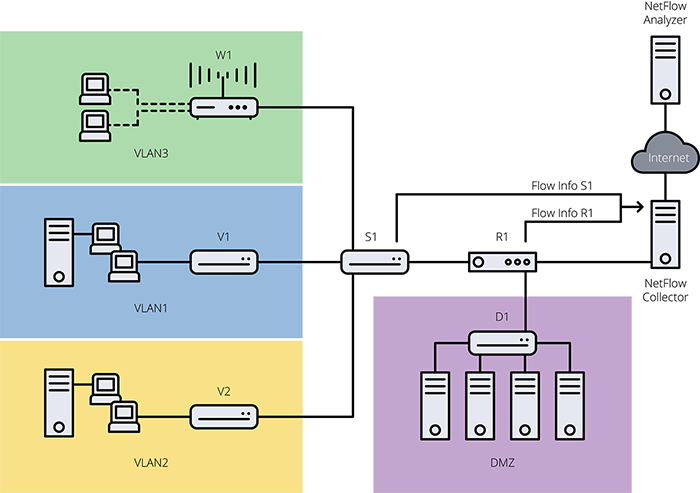
If you enable NetFlow on the main switch connecting the different departments (S1), you also gain instant visibility into all internal network traffic as well, typically referred to as east-west traffic.
In sum, NetFlow is a powerful tool for monitoring any network. With its simplicity and ability to inexpensively collect a wide array of detailed metrics, you can use NetFlow to inspect, assess, plan, troubleshoot and secure all your client networks.